
Seasoned investors know the sharpest proforma can still crumble if market shifts catch you off guard. In commercial real estate, financial sensitivity analysis offers a proactive way to measure a property's exposure to changing cap rates, interest rates, construction costs, vacancy, and rents before significant capital is committed. By running these stress tests, you build a true picture of your deal’s resilience, avoiding fragile assumptions and making smarter decisions in volatile North American markets.
Table of Contents
- Defining Financial Sensitivity Analysis In CRE
- Common Methods And Types Explained
- Key Inputs And Scenarios To Analyze
- Benefits, Limitations, And Risk Reduction
- Mistakes To Avoid In Sensitivity Modeling
Key Takeaways
| Point | Details |
|---|---|
| Importance of Sensitivity Analysis | It helps investors assess the impact of variable changes on investment returns, reinforcing disciplined decision-making before capital commitment. |
| Methods of Sensitivity Analysis | Employ one-way, two-way, and scenario analyses to reveal critical assumptions, interactions, and real-world implications for better risk management. |
| Identifying Key Variables | Focus on core inputs like cap rates, interest rates, and vacancy rates that directly influence returns and shape effective testing scenarios. |
| Risk Mitigation Strategies | Combine insights from sensitivity analysis with continuous monitoring and scenario-based stress testing to create a robust risk management framework. |
Defining Financial Sensitivity Analysis in CRE
Sensitivity analysis is how you stress-test your deal assumptions before you commit capital. It answers the question every investor should ask: "What if my numbers are wrong?"
At its core, sensitivity analysis examines how changes in key variables impact your investment returns. In commercial real estate, this means testing what happens to your profit, cash flow, and cap rate when market conditions shift. You're not predicting the future—you're measuring your deal's vulnerability to reality.
Commercial real estate sensitivity analysis evaluates how factors like cap rates, interest rates, construction costs, vacancy, and rents affect property profitability. By understanding these financial implications of your core assumptions, you avoid surprises that could tank your returns.
Here's what sensitivity analysis tests in a typical CRE deal:
- Interest rate changes: How does a 0.5% or 1% rate increase affect your debt service and equity returns?
- Rental income fluctuations: What if market rents stay flat instead of climbing 2% annually?
- Vacancy assumptions: Your model assumes 5% vacancy. What happens at 8% or 10%?
- Cap rate compression or expansion: How sensitive is your exit price to yield changes?
- Expense growth: What if operating costs accelerate faster than your inflation assumption?
- Refinancing scenarios: How do different rate environments at refinance affect your hold-period returns?
Think of it as building a financial shock-absorption system into your underwriting. You're mapping the boundaries between profit and loss before you sign the purchase agreement.
Most investors make assumptions in their proforma without testing them. They assume 3% annual rent growth because that's what they've seen historically. They plug in a 5% cap rate based on recent comps. They assume 95% occupancy. Then markets shift, and suddenly those assumptions look reckless.
Sensitivity analysis forces discipline. It reveals which assumptions matter most and which have minimal impact on returns. Some deals break even with small changes to one variable. Others stay profitable across wide ranges of outcomes.
Sensitivity analysis separates robust deals from deals built on fragile assumptions.
This is the foundation for smarter CRE investing. Once you understand how your deal reacts to different scenarios, you can make informed decisions about pricing, structure, and hold periods.
Pro tip: Start by testing the two variables that move most in your market—usually cap rates and interest rates. This 80/20 approach reveals your biggest risks without overwhelming your analysis.
Common Methods and Types Explained
There's no single "right" way to run sensitivity analysis. Different methods serve different purposes, and smart investors use multiple approaches to stress-test their deals from different angles.
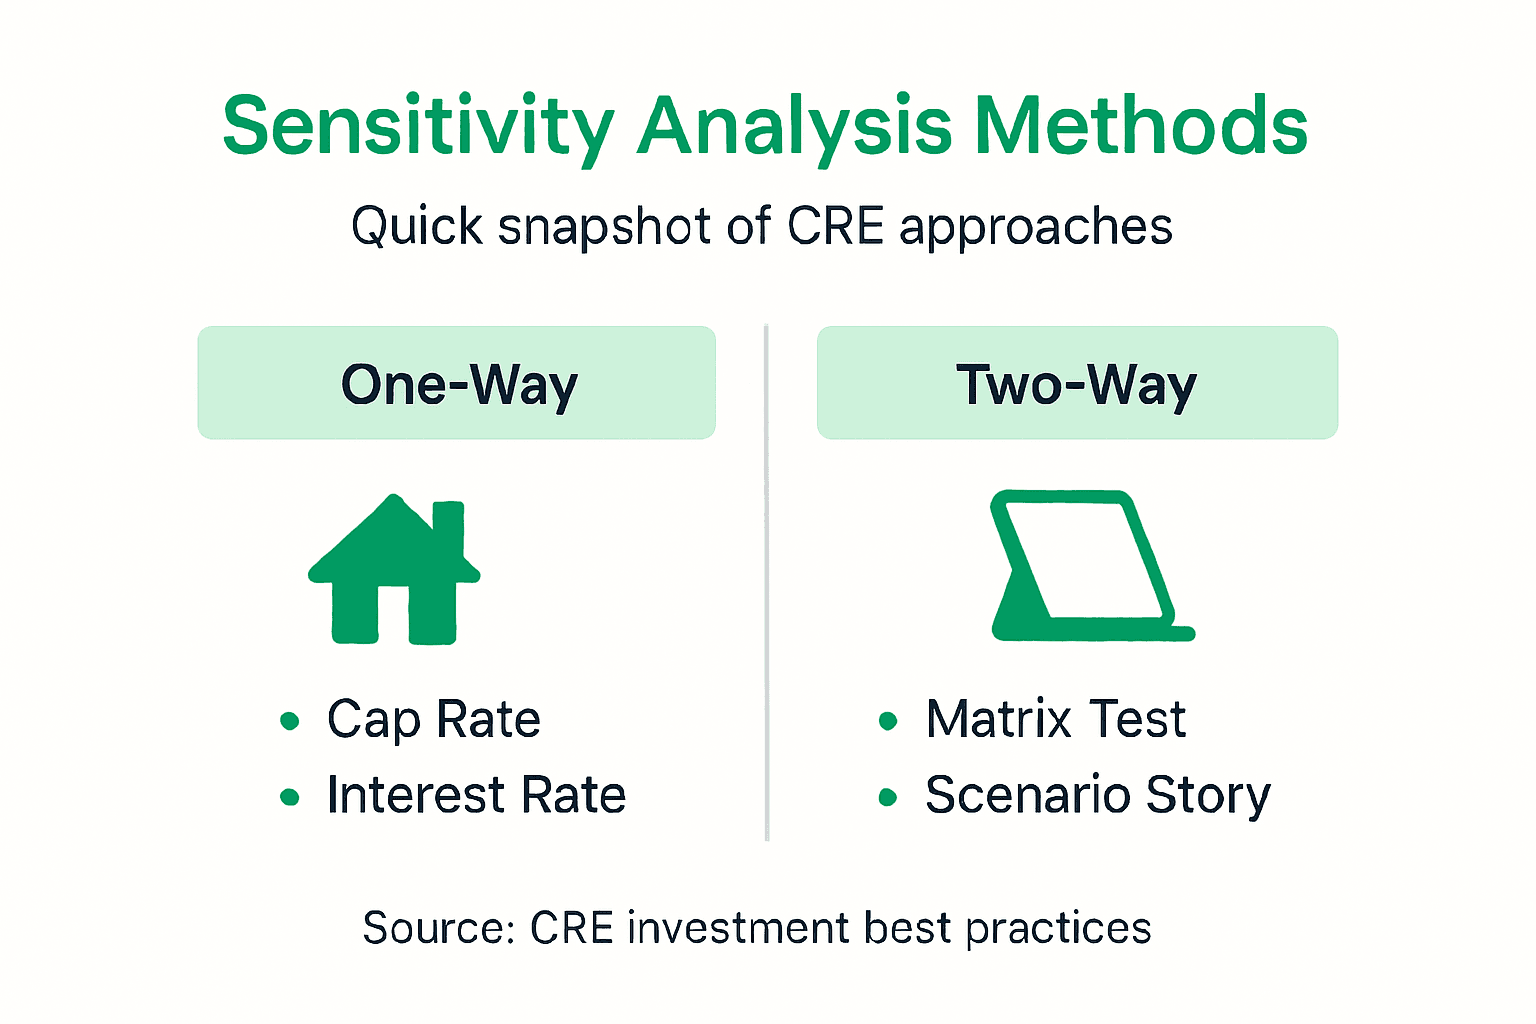
One-Way Sensitivity (The Baseline)
One-way sensitivity tests how a single variable impacts your returns while holding everything else constant. You might increase the cap rate from 5% to 6% and see how the IRR changes. Then you go back to 5%, adjust the interest rate, and measure the impact. Rinse and repeat for each key driver.
This method is straightforward and reveals which variables pack the most punch:
- Identifying critical variables: See which assumption changes matter most
- Testing ranges: Model optimistic, base case, and pessimistic scenarios
- Quick iteration: Fast to calculate and easy to communicate to partners
- Visual clarity: Creates simple charts showing relationship between input and output
One-way sensitivity works perfectly when you're presenting to investors who need to understand deal mechanics quickly. Show them: "If cap rates expand by 50 basis points, your IRR drops from 18% to 14%." That clarity builds confidence.
Two-Way Sensitivity (The Matrix)
Two-way sensitivity tests how two variables interact. You create a matrix showing how returns change as both cap rate and interest rate move simultaneously. It's more complex but captures real-world correlation.
When you're evaluating a lease with both base rent and expense stops, a two-way analysis shows scenarios where both variables move together. Markets don't change one thing at a time—they shift in patterns.
Two-way analysis reveals:
- Variable interactions: How do assumptions combine to create outcomes?
- Stress zones: Where does profitability collapse?
- Pricing leverage: What trade-offs exist between key drivers?
Scenario Analysis (The Storytelling Approach)
Scenario analysis bundles multiple variable changes into cohesive narratives. Instead of testing interest rates in isolation, you model a "recession scenario" that includes higher vacancy, lower rents, cap rate expansion, and refinancing challenges all at once.
Scenarios tell stories: Bear case, base case, bull case. Each one reflects a plausible market environment rather than arbitrary number changes.
Use scenarios when:
- Communicating with non-technical stakeholders
- Presenting to lenders or debt providers
- Evaluating portfolio-level risk exposure
- Testing specific market conditions you're concerned about
The best analysis combines all three methods: one-way for detail, two-way for interaction, scenarios for context.
Pro tip: Start with one-way sensitivity on your top 5 variables, then build a two-way matrix for the two that matter most. Add 3-4 scenarios last—this progression saves time while covering your downside risks.
Here is a comparison of sensitivity analysis methods used in commercial real estate:
| Method | Variables Tested | Insights Provided | Ideal Use Case |
|---|---|---|---|
| One-Way Sensitivity | Single variable | Pinpoints critical drivers of returns | Quick investor presentations |
| Two-Way Sensitivity | Two variables | Reveals variable interaction and stress | Deep risk evaluation |
| Scenario Analysis | Multiple variables | Demonstrates outcome in real-world events | Stakeholder communication |
Key Inputs and Scenarios to Analyze
Not all variables deserve equal attention in your sensitivity analysis. You need to identify which inputs actually move the needle on returns, then test realistic scenarios around those drivers.
The Core Input Variables
Key inputs in CRE sensitivity analysis include cap rates, interest rates, construction costs, vacancy rates, and rental income. These variables form the foundation of every proforma model and deserve rigorous testing.

Here's what each variable controls:
The following table summarizes major input variables and their typical business impact:
| Input Variable | Direct Impact | Typical Risk if Assumptions Missed |
|---|---|---|
| Cap Rate | Exit value, IRR | Reduced returns, mispricing |
| Interest Rate | Debt cost, cash flow | Higher costs, refinance risk |
| Vacancy Rate | Revenue, NOI | Lost income, higher default risk |
| Rental Growth | Inflation hedge, returns | Stagnation, poor yield |
| Operating Expenses | Cash flow, DSCR | Budget overruns, margin squeeze |
| Construction Costs | Project viability | Delays, cost inflation |
- Cap rates: Drive your exit value and directly impact returns. A 50 basis point shift can swing your IRR by 2-4 percentage points.
- Interest rates: Affect debt service costs and refinancing risk. Even 0.25% increases compress cash flow significantly.
- Vacancy rates: Reduce revenue projections. Moving from 5% to 8% vacancy cuts NOI by 6% on a typical deal.
- Rental income growth: Determines whether your property keeps pace with inflation or stagnates in real dollars.
- Operating expenses: Often underestimated. Testing 0.5% annual growth versus 3% reveals major cash flow risk.
- Construction costs: Critical for development deals. Material price swings directly impact project budgets and timelines.
Building Your Test Scenarios
Start with three core scenarios: base case, best case, and worst case. Your base case reflects realistic market conditions using recent market data. Best case and worst case define your upside and downside boundaries.
Base case uses your most likely assumptions:
- 3% annual rent growth based on historical market trends
- 6% cap rate based on recent comparable sales
- 5% vacancy based on average historical occupancy
- Current market interest rate plus 150 basis points for DSCR cushion
Best case tests optimistic but plausible conditions:
- Rents climb 4.5% annually (strong market demand)
- Cap rates compress to 5.25% (increasing investor appetite)
- 3% vacancy (excellent operational performance)
- Interest rates decline 0.5% from base assumption
Worst case models realistic stress:
- Rents flat or declining 1% annually (market weakness)
- Cap rates expand to 7% (flight to quality, investor caution)
- 8% vacancy (tenant defaults, slower leasing velocity)
- Interest rates increase 0.75% from base assumption
Don't create fantasy scenarios. Test conditions you've actually seen in your market during downturns or booms.
Variables That Matter Most by Property Type
Multifamily and office deals are sensitive to vacancy and rent growth. Retail hinges on tenant credit and lease term. Industrial depends heavily on cap rate and interest rate movements. Test what actually matters for your deal type.
The variables you test must reflect your deal's vulnerability and your market's history.
Once you've identified your core inputs and scenarios, measure how they affect three critical outputs: net operating income, debt service coverage ratio, and IRR. These three metrics tell you whether the deal survives, whether it services debt, and whether it delivers returns.
Pro tip: Run your scenarios for two dates: year 1 and year 5. Early stress tests your financing capability. Year 5 stress tests your exit assumptions—often where deals surprise investors.
Benefits, Limitations, and Risk Reduction
Sensitivity analysis isn't a crystal ball. It won't predict the future. But it will reveal which risks matter most and where your deal has breathing room. That clarity changes how you price, structure, and manage investments.
The Real Benefits
Sensitivity analysis delivers concrete advantages that directly impact your bottom line:
- Identifies critical vulnerabilities: Pinpoint which assumptions could break your deal before you commit capital.
- Informs pricing strategy: Know whether you can afford to bid higher based on resilience across scenarios.
- Strengthens lender relationships: Banks respect underwriters who stress-test assumptions. You'll negotiate better terms.
- Protects equity returns: Understand downside scenarios before they happen, not after you've invested.
- Enables better negotiations: When you know cap rates moving 50 basis points costs you 2% IRR, you negotiate differently with sellers.
- Supports capital raises: Investors trust sponsors who present realistic base case plus credible stress scenarios.
CRE risk assessment through sensitivity analysis provides enhanced investment protection and better mitigation strategies. You move from hoping your assumptions hold to understanding what happens if they don't.
Understanding the Limitations
But sensitivity analysis has real constraints you need to acknowledge:
Data gaps: Your historical data might not reflect future conditions. Pre-pandemic vacancy rates look quaint now.
Correlation blindness: One-way sensitivity assumes variables move independently. In reality, when cap rates expand, interest rates usually rise too. Your variables are correlated.
Model bias: You build assumptions based on your experience and beliefs. Unconscious biases creep in. You might underestimate recession risk because you've only seen recovery.
Black swan events: Sensitivity analysis tests ranges within historical norms. It won't predict pandemic lockdowns, war, or financial crises that fall outside your tested scenarios.
Execution risk: The numbers assume you execute flawlessly. Real deals involve tenant defaults, construction overruns, and management missteps that models ignore.
Reducing Risk Beyond Sensitivity Analysis
Sensitivity analysis is one tool in a larger risk management framework. Integrate it with other practices:
- Scenario-based stress testing: Layer external macro scenarios (recession, rate shock) on top of deal-specific sensitivity.
- Continuous monitoring: Update assumptions quarterly. Markets change faster than annual business plans.
- Portfolio diversification: Spread exposure across property types, geographies, and borrowing structures.
- Reserve strategies: Build operating reserves and capital reserves to absorb surprises your scenarios didn't capture.
- Exit planning: Map multiple exit paths rather than betting on one refinance or sale price.
Sensitivity analysis reveals risk. Other tools help you manage it.
The strongest investors use sensitivity analysis to ask better questions, not to claim certainty. They run the numbers, understand the ranges, then apply judgment about which scenarios they'll prepare for.
Pro tip: Test your worst-case assumptions against actual market downturns from the last 20 years. If your worst case is better than 2008 conditions, stress harder. Historical context prevents overconfidence.
Mistakes to Avoid in Sensitivity Modeling
Most investors make the same sensitivity analysis mistakes repeatedly. They run the numbers, miss the obvious pitfalls, and wonder why their analysis doesn't prevent surprises. Learn from these common errors.
The Single-Variable Trap
The biggest mistake is testing variables in isolation. You change the cap rate, hold everything else constant, and measure the impact. Then you change the interest rate the same way. This approach creates false confidence.
Markets don't work that way. When cap rates expand, interest rates usually rise too. When vacancy spikes, landlords often delay rent growth. Your variables are correlated, and single-variable sensitivity misses those relationships entirely.
Instead, run two-way sensitivity on your most critical pairs. Test cap rate expansion alongside interest rate increases. Model vacancy alongside rent growth changes. This reveals whether your deal survives when multiple stresses hit simultaneously.
Static Assumptions That Drift
Sensitivity modeling mistakes include overreliance on static assumptions rather than dynamic inputs that update as conditions change. You build a model in January with current market data. By June, interest rates have moved 75 basis points, but your sensitivity analysis still uses January inputs.
Static assumptions reduce predictive power. Markets move faster than spreadsheets. Commit to updating your model quarterly at minimum. When market conditions shift materially, recalculate your sensitivities.
Neglecting Scenario Context
Another critical error: running sensitivity without scenarios. You test what happens if cap rates move 25, 50, or 75 basis points. But you don't connect those numbers to real market conditions.
Avoid this by pairing sensitivity with scenario analysis:
- Best case: Rents accelerate 4.5%, cap rates compress to 5.25%, vacancy drops to 3%
- Base case: 3% rent growth, 6% exit cap rate, 5% vacancy
- Worst case: Flat or negative rents, cap rates expand to 7%, 8% vacancy
Scenarios give meaning to your sensitivity outputs. They show what happens in plausible market environments, not just arbitrary number changes.
Misinterpreting Outputs
You calculate that a 1% cap rate increase drops your IRR from 18% to 12%. Then you move forward assuming that won't happen because cap rate expansion seems unlikely.
Don't interpret sensitivity outputs as probability statements. They show mathematical relationships, not forecasts. A 6% outcome probability doesn't mean you ignore it. In commercial real estate, low-probability scenarios happen regularly.
Context matters. Ask yourself: Has this market seen cap rate expansion of this magnitude before? When? How did deals perform? Historical perspective prevents false confidence.
Sensitivity analysis answers "what if." Scenarios answer "could this happen?" You need both.
The strongest models combine comprehensive sensitivity testing on multiple variables, realistic scenarios grounded in market history, and quarterly updates as conditions change. This approach catches real risks before they materialize.
Pro tip: Document your assumption sources and update dates in your model. When lending teams or investors question your numbers, you'll have evidence that assumptions reflect current market conditions, not old data.
Make Smarter CRE Decisions with AI-Powered Sensitivity Analysis
Sensitivity analysis is essential for understanding risks like cap rate shifts, interest rate changes, and vacancy fluctuations in commercial real estate deals. The article highlights how testing multiple scenarios and variables can protect your investment from unexpected market moves and improve negotiation tactics. Yet performing this level of detailed analysis manually is time-consuming and prone to error.
DealCrunch.ai solves this challenge by providing an all-in-one AI-powered Deal Command Center designed specifically for brokers, investors, landlords, and tenants. Our platform features intuitive sensitivity analysis tools that let you stress-test assumptions such as cap rates, rental growth, and refinancing scenarios with speed and precision. You gain clear insights on deal health, investor returns, and downside risks without the hassle of spreadsheets.
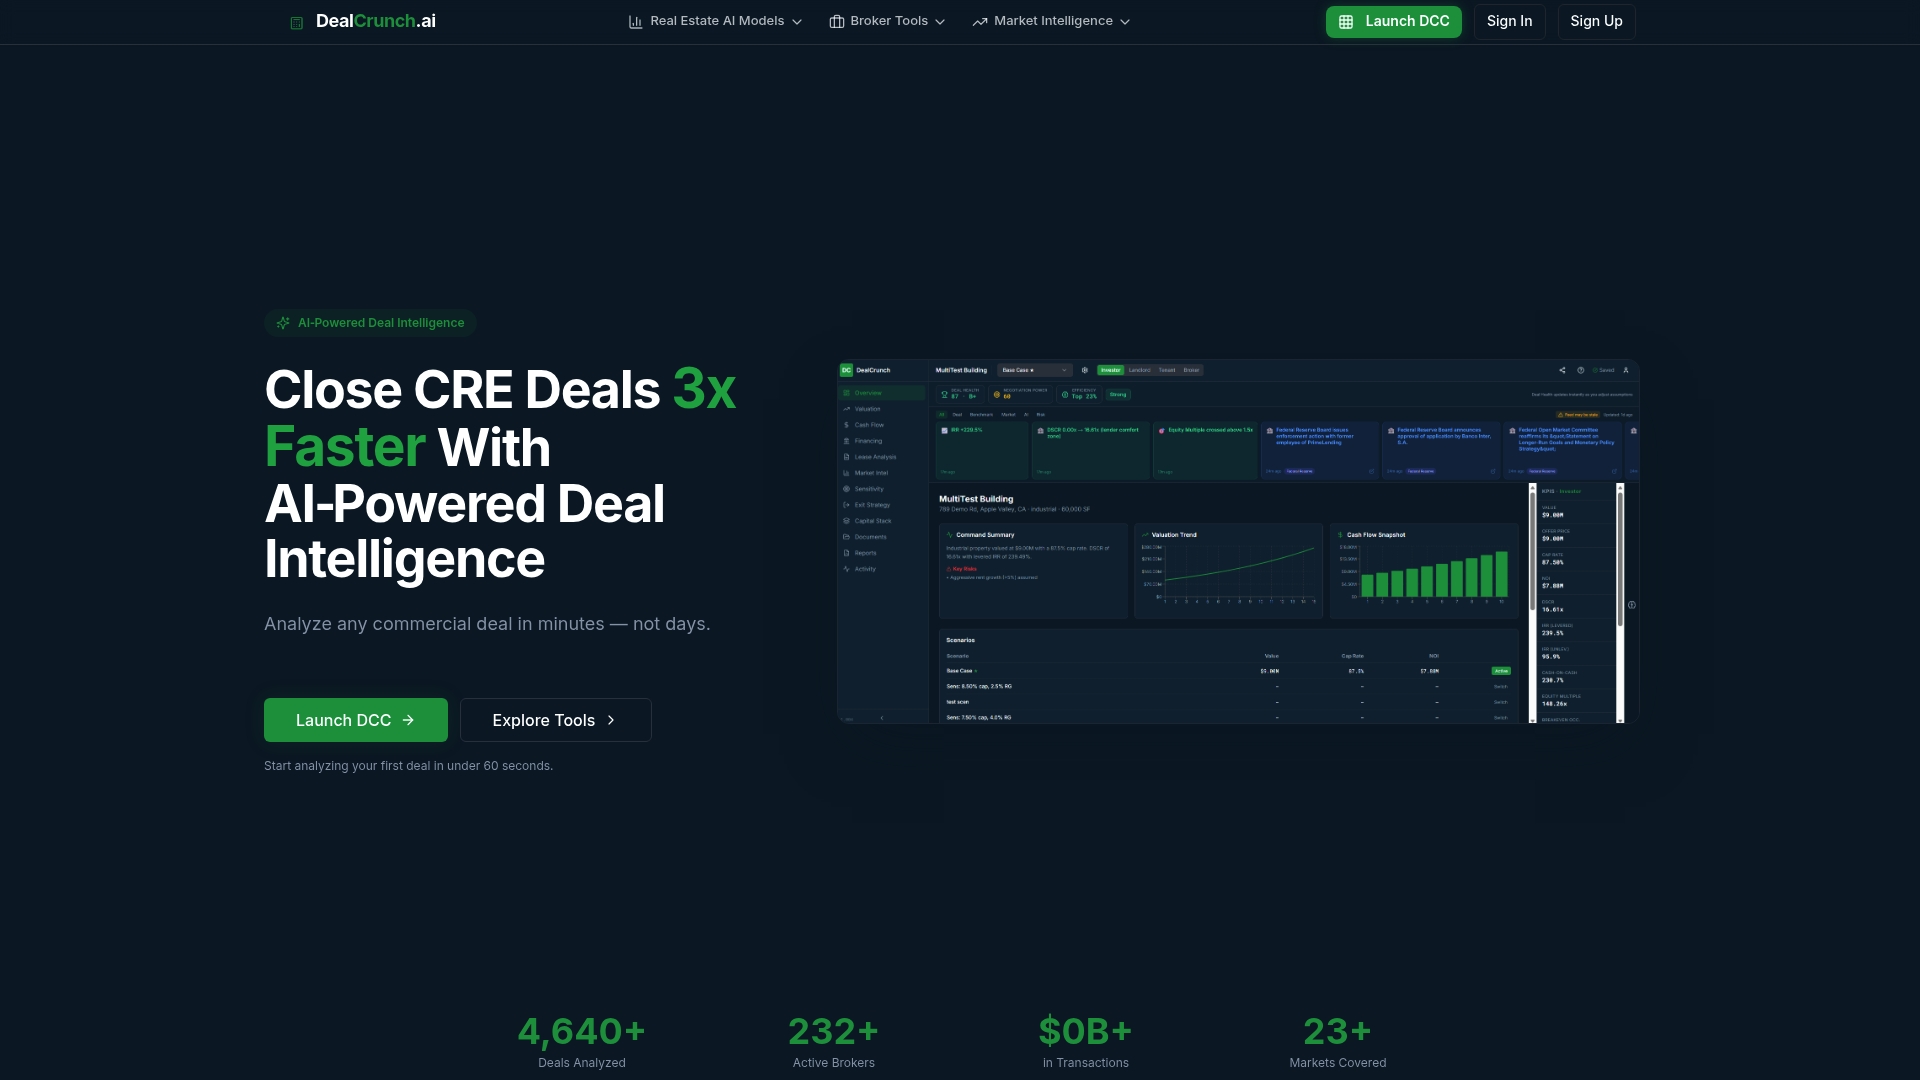
Step up your underwriting game now and avoid costly mistakes from static models or overlooked variable interactions. Visit DealCrunch.ai to explore 10-year proforma modeling, scenario comparison engines, and professional report exports that make presenting complex CRE deals straightforward and persuasive. Make confident decisions today with smarter sensitivity analysis powered by AI.
Frequently Asked Questions
What is financial sensitivity analysis in commercial real estate?
Financial sensitivity analysis is a method used to evaluate how changes in key variables, such as cap rates, interest rates, and vacancy rates, impact investment returns in commercial real estate. It helps investors understand the potential risks and vulnerabilities of their investment assumptions before committing capital.
Why is sensitivity analysis important for CRE investors?
Sensitivity analysis is important for CRE investors because it reveals critical vulnerabilities in their financial assumptions. It helps them make informed decisions about pricing, structuring deals, and managing risks associated with market fluctuations, ultimately protecting their returns.
How do I perform a one-way sensitivity analysis?
To perform a one-way sensitivity analysis, change a single variable—like the cap rate or interest rate—while keeping all other variables constant. Measure how this change impacts your investment's returns, such as the IRR. Repeat this process for each key variable to determine which has the most significant effect on profitability.
What are the common input variables to test in sensitivity analysis?
Common input variables to test in sensitivity analysis include cap rates, interest rates, vacancy rates, rental income growth, operating expenses, and construction costs. These variables significantly influence the financial performance of commercial real estate deals.